Best LinkedIn Lead Gen Metrics in 2026, Ranked by Revenue Impact

I spent two years at Salesforce watching SDRs celebrate connection acceptance rates like they'd just closed a six-figure deal. Meanwhile, their actual pipeline contribution was somewhere between disappointing and nonexistent.
The problem wasn't effort. It was that we were measuring the wrong things. LinkedIn lead generation isn't about vanity metrics like profile views or post impressions. It's about tracking the handful of numbers that actually correlate with closed revenue.
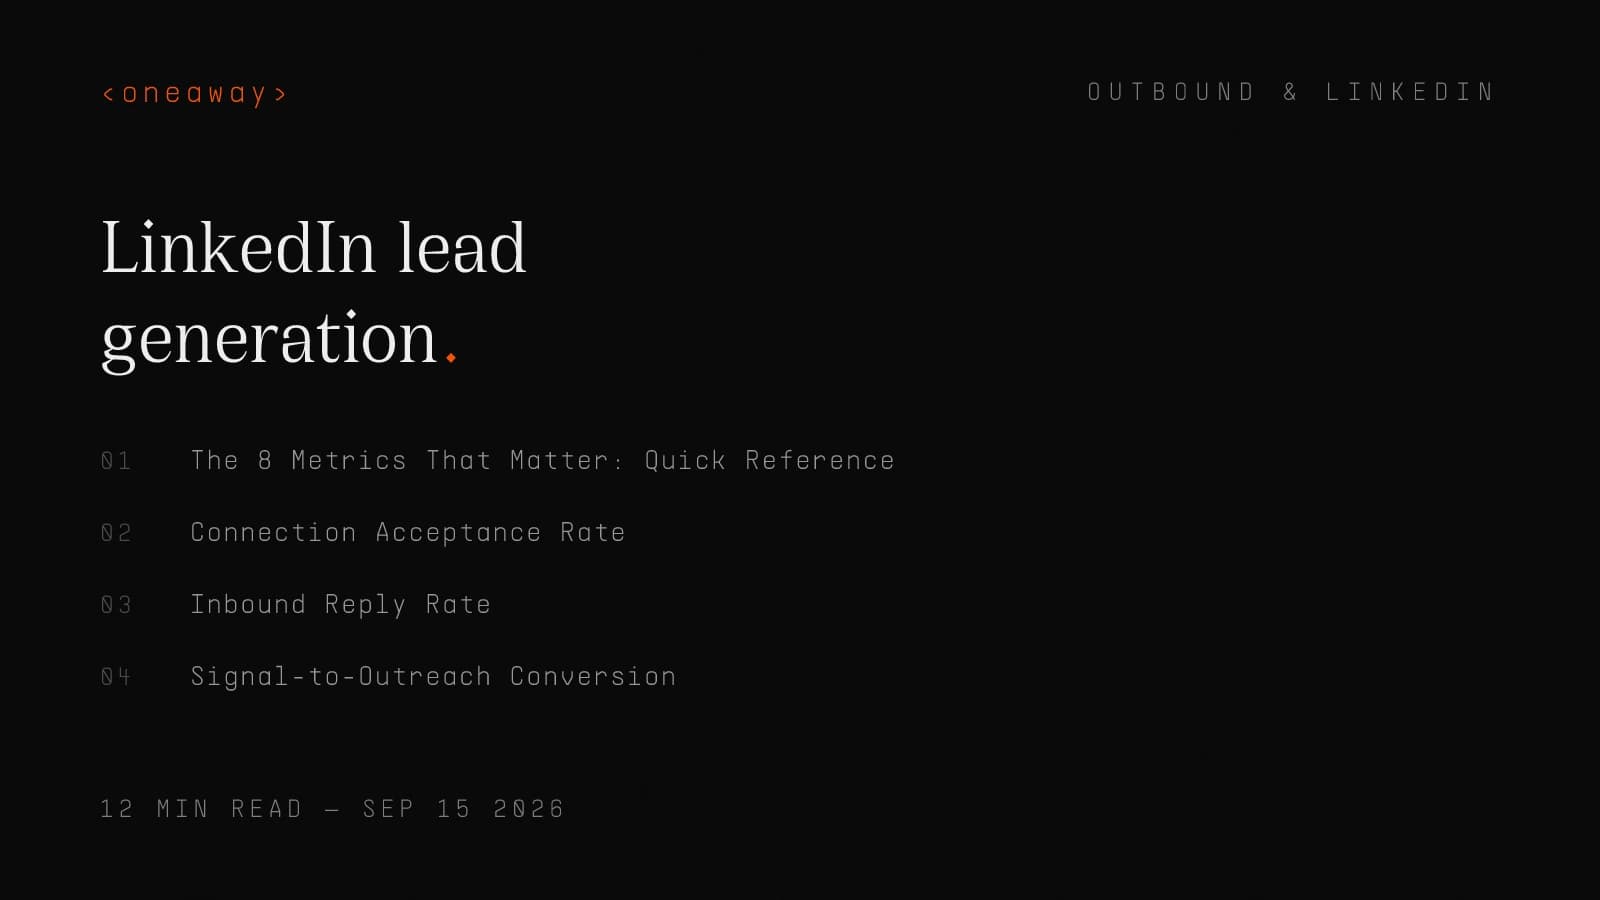
After running LinkedIn programs for dozens of B2B clients at oneaway, I've seen which metrics move the needle and which ones just make your dashboard look busy. Here are the 8 LinkedIn lead generation metrics that actually matter in 2026, ranked by their direct impact on pipeline and revenue.
The 8 Metrics That Matter: Quick Reference
Before we dive deep, here's the full ranking. I've included 2026 benchmarks from our client data and industry sources, plus why each metric matters for B2B LinkedIn leads.
| Metric | 2026 Benchmark | Revenue Impact | Why It Matters |
|---|---|---|---|
| Pipeline Velocity (Days) | 18-32 days faster | Highest | Directly impacts cash flow and close rate |
| LinkedIn Lead-to-Close Rate | 14.6% (inbound) | Highest | Predicts actual revenue, not just activity |
| Cost Per Qualified Lead | $45-$180 (ads) | High | Determines program profitability |
| LinkedIn-Sourced Pipeline ($) | $250K-$2M+ monthly | High | Attribution that matters to CFOs |
| Meeting Booking Rate | 8-15% (outbound) | Medium-High | First real conversion milestone |
| Signal-to-Outreach Conv. | 40-60% acceptance | Medium | Quality indicator for targeting |
| Inbound Reply Rate | 25-55% (signals) | Medium | Measures message relevance |
| Connection Accept Rate | 10-60% (varies) | Low | Top of funnel health check only |
#8: Connection Acceptance Rate
What it is: The percentage of connection requests that get accepted. Seems basic, but the 2026 data shows a massive quality split.
2026 Benchmarks: Cold list outreach gets 10-20% acceptance. Signal-based outreach (job changes, funding, content engagement) gets 40-60% acceptance. That's not a typo—the gap is 3-4x.
- Why it ranks #8: — Acceptance rate is a leading indicator, not a revenue predictor. High acceptance with low reply rates just means you're good at connection requests but bad at conversations. I've seen teams with 45% acceptance rates and zero pipeline.
- What good looks like: — If you're below 30% acceptance in 2026, your targeting is broken. Above 50%? You're either using signals well or your ICP is too broad. We aim for 40-50% with tight targeting.
- Real example: — One of our SaaS clients was celebrating a 52% acceptance rate until we looked at replies. Only 6% were responding. Turned out they were connecting with anyone who fit the job title, ignoring buying signals. We tightened to signal-based targeting, acceptance dropped to 43%, but reply rate jumped to 31%.
#7: Inbound Reply Rate
What it is: Percentage of accepted connections who reply to your first message. This is where most LinkedIn lead gen strategies fall apart.
2026 Benchmarks: Cold outreach gets 3-8% reply rates. Signal-based gets 25-55%. Multichannel (LinkedIn + email sequences) adds another 15-20% lift.
- Why it ranks #7: — Reply rate tells you if your message resonates, but replies don't equal revenue. I've had prospects reply 'not interested' or 'maybe next quarter' for months. High reply rate with low meeting conversion is just polite rejection at scale.
- What moves the needle: — Personalization at the company level (mentioning recent news, funding, job posts) beats name-merge personalization every time. At AWS, I tested both. Company-specific context got 38% replies vs 12% for first-name-only messages.
- The signal advantage: — When someone just changed jobs, got promoted, or their company raised funding, they're 4-6x more likely to reply. That's not because your message is better—it's because timing matters more than copy.
#6: Signal-to-Outreach Conversion
What it is: Acceptance and reply rates specifically from prospects you reached based on intent signals (job changes, content engagement, website visits, funding events).
2026 Reality: This is the metric that separates teams still doing cold list pulls from teams actually winning. Signal-based targeting isn't optional anymore—it's table stakes for LinkedIn prospecting tools.
- Why it ranks #6: — Signal conversion predicts downstream quality. If your signal-based acceptance is below 40%, either your signals are weak or your message doesn't connect the dots. But even great signal conversion doesn't guarantee pipeline if your product-market fit is off.
- Signals that actually work: — Job changes in the first 90 days, funding announcements in the first 30 days, and engaged content viewers (3+ post interactions in 14 days). We track these separately because conversion rates vary 2-3x across signal types.
- Client example: — A revenue ops platform we work with gets 58% acceptance and 47% reply from new VP Sales hires in their first 45 days. Same company, same message to cold lists? 14% and 5%. We shifted 80% of outreach budget to signal-based and pipeline doubled in one quarter.
#5: Meeting Booking Rate
What it is: Percentage of conversations that result in a booked meeting. This is where LinkedIn motion converts to actual sales activity.
2026 Benchmarks: Outbound LinkedIn gets 8-15% meeting booking from replies. Inbound (people reaching out to you) converts at 25-40%. Content-led generates the highest quality—we see 30-45% meeting rates from engaged followers.
- Why it ranks #5: — Meeting booking is the first metric that sales leadership actually cares about. But not all meetings are equal. A 15% booking rate with 50% no-show is worse than 10% with 90% attendance. Track both.
- The qualification gap: — In my Salesforce days, I booked meetings at 22% from LinkedIn conversations. Sounds great until you learn that only 38% were qualified opportunities. I was optimizing for bookings, not pipeline. Now we track qualified meeting rate instead—typically 6-9% of total conversations.
- Multichannel impact: — Combining LinkedIn messages with email sequences increases meeting booking by 40-60%. We use LinkedIn for warm-up and context, email for the actual meeting request. It works because each channel has different response patterns.
#4: LinkedIn-Sourced Pipeline ($)
What it is: Total dollar value of opportunities where LinkedIn was the originating source. Not influenced. Not touched. Sourced.
2026 Reality: This is the metric that saves LinkedIn programs during budget reviews. LinkedIn generates 80% of all B2B social media leads, but only if you're tracking attribution correctly.
- Why it ranks #4: — Dollar pipeline is what gets you budget, headcount, and executive attention. I've seen great LinkedIn programs get cut because they couldn't prove sourced pipeline. Track this religiously or someone else decides your program value.
- Attribution standards: — First-touch attribution for outbound (you reached out first). Source attribution for inbound (they found you via LinkedIn). Last-touch is garbage for LinkedIn—it almost always loses to 'direct' or email in multi-touch journeys.
- Scale benchmarks: — Early-stage teams should hit $50K-$150K monthly sourced pipeline per full-time SDR focused on LinkedIn. Growth-stage with ads and content can hit $250K-$500K per person. Enterprise with brand momentum sees $1M+ per person, but that's rare.
- Real numbers: — One of our Series B clients runs a team of 4 SDRs doing signal-based LinkedIn outreach plus one person running content. They source $1.8M in pipeline monthly, with $2.2M when you include LinkedIn Ad conversions. That's the program baseline that justifies everything else.
#3: Cost Per Qualified Lead
What it is: Fully-loaded cost (tools, salaries, ads) divided by qualified leads generated. The efficiency metric that determines if your program scales or dies.
2026 Benchmarks: LinkedIn Ads CPL ranges $45-$180 depending on targeting and vertical. Outbound motion (tools + salary) runs $200-$400 per qualified lead. Content-led inbound gets as low as $50-$120 at scale.
- Why it ranks #3: — Cost per lead tells you whether your LinkedIn motion is financially viable before you scale it. I've watched teams triple their LinkedIn spend based on vanity metrics, only to realize their CPL made the program unprofitable. Math matters.
- The 2026 LinkedIn Ads reality: — LinkedIn raised prices significantly in early 2026 and handed more control to AI. Average CPL climbed 25-40% across most verticals. If you're running ads the same way you did in 2024, you're burning cash. Signal-based retargeting and content syndication are the only ad plays that still pencil out.
- Outbound cost breakdown: — Assume $80K fully-loaded cost per SDR (salary, tools, overhead). Target 20-30 qualified leads per month. That's $2.7K-$4K per lead. Sounds expensive until you realize your average deal is $45K and close rate is 18%. The unit economics work.
- Content-led advantage: — We run a content program for a sales automation company. One rep posting 3x weekly plus engaging with their ICP. Cost: $6K/month (fractional creator + tool stack). Output: 45-60 qualified inbound leads monthly. That's $100-$133 CPL and the leads close at 22% vs 14% for outbound.
#2: LinkedIn Lead-to-Close Rate
What it is: Percentage of LinkedIn-sourced leads that turn into closed-won revenue. The quality metric that determines whether LinkedIn is a real channel or just top-of-funnel theater.
2026 Benchmarks: Inbound LinkedIn leads close at 14.6% on average (significantly higher than most channels). Outbound LinkedIn closes at 8-12%. Content-engaged leads hit 16-24% because they're pre-educated.
- Why it ranks #2: — Close rate is the ultimate quality filter. You can generate 1,000 LinkedIn leads, but if they close at 3%, your program sucks. Close rate separates real pipeline from lead theater. This is the metric I show CEOs when they question LinkedIn investment.
- The inbound premium: — People who find you through content or personal brand close at nearly 2x the rate of outbound. At AWS, my inbound LinkedIn leads (people who reached out after seeing content) closed at 19% vs 9% for my outbound. The quality difference was unmistakable.
- Why it's not #1: — Close rate matters enormously, but it's a lagging indicator. You don't know your close rate until 90-180 days after lead generation. It's critical for program validation but useless for in-quarter optimization. That's why velocity beats it.
- Tracking gotcha: — Most CRMs attribute to last touch or 'direct' for long sales cycles. If you don't have custom source fields for LinkedIn-originated leads, your close rate data is fiction. We implement custom attribution tracking for every client—it's not optional.
#1: Pipeline Velocity (Days)
What it is: How much faster LinkedIn-sourced deals move through your pipeline compared to other channels. This is the metric nobody talks about and everyone should obsess over.
2026 Reality: LinkedIn-sourced deals close 18-32 days faster on average than cold email or other outbound channels. That velocity advantage compounds into more revenue, better cash flow, and higher team efficiency.
- Why it ranks #1: — Velocity is the only metric that directly impacts revenue in-quarter while predicting future performance. Faster deals mean more closes per rep, better cash flow, and less deal risk. A 25-day velocity improvement on a 90-day sales cycle means you close 38% more deals per year with the same team.
- The compounding effect: — If your average deal is $45K and your sales cycle is 90 days, a LinkedIn program that cuts cycle time to 65 days lets each rep close 5.6 deals per year instead of 4. That's 40% more revenue per head without changing close rate or adding headcount.
- Why LinkedIn accelerates deals: — LinkedIn-sourced deals move faster because of context. When someone converts after engaging with your content or accepts your connection based on a signal, they're pre-educated. They skip or compress the awareness and education stages. You're not starting from cold.
- Real client data: — We track this religiously. A B2B martech client has a 78-day average sales cycle. LinkedIn-sourced deals close in 52 days. Email-sourced? 91 days. That 26-day advantage means their LinkedIn-focused reps quota-retire every quarter while email reps struggle.
- How to measure it: — Most CRMs track 'days in pipeline' by default. Create a custom report filtering for LinkedIn-sourced opps vs all others. If you don't see a 15+ day velocity advantage, your LinkedIn program isn't differentiated enough—you're just using it as another cold outreach channel.
Metrics That Don't Matter (But Everyone Tracks)
Let's talk about the metrics you should stop reporting to leadership. These look good on dashboards but predict nothing about revenue.
- Profile views: — Totally meaningless. I've had 1,200 profile views in a week with zero conversations. Profile views are a vanity metric that makes you feel busy. Stop tracking them.
- Post impressions: — Impressions measure reach, not engagement or intent. A post with 10,000 impressions and 12 likes is a failed post. Track engaged viewers (people who like, comment, or click) and conversion from engagement to conversations instead.
- Social Selling Index (SSI): — LinkedIn's proprietary score is a nice gamification play but it doesn't correlate with pipeline. I've seen reps with 75+ SSI and no deals, and quota-crushers with a 45 SSI who ignore content. Ignore this completely.
- Connection count growth: — Having 5,000 connections means nothing if none of them are your ICP. One client had 8,200 connections and 3% were targetable. Another had 1,400 connections and 62% were ICP. Guess which one sourced more pipeline?
- Message volume: — Sending 200 messages per week is not an achievement if your reply rate is 4%. Volume metrics encourage spray-and-pray behavior. Track conversion rates, not activity counts.
How to Actually Track These Metrics
Knowing which metrics matter is pointless if you can't measure them. Here's the stack and process we use for clients to track LinkedIn sales leads properly.
FAQ
Key Takeaways
Frequently Asked Questions
What's the most important LinkedIn lead generation metric to track first?
Start with meeting booking rate and pipeline velocity. Meeting booking tells you if your message and targeting work. Velocity tells you if LinkedIn leads are actually better quality. If you can only track one thing, track velocity—it's the best predictor of program ROI.
How do I calculate pipeline velocity for LinkedIn-sourced deals?
In your CRM, filter opportunities by source = LinkedIn. Calculate average days from opportunity created to closed-won. Compare that to your overall average. The difference is your velocity advantage. Most B2B companies see 15-35 days faster close times for LinkedIn-sourced deals when they're doing it right.
What's a good LinkedIn lead-to-close rate in 2026?
For outbound LinkedIn prospecting, 8-12% is solid. Inbound leads (people who reach out to you) should close at 14-18%. Content-engaged leads can hit 20%+ because they're pre-educated. If you're below 8%, your targeting or qualification process needs work.
Should I use LinkedIn Ads or organic outreach for lead generation?
Both, but for different purposes. Organic outreach (connection requests + messages) works better for signal-based targeting and relationship building. Ads work for retargeting engaged audiences and content syndication. In 2026, ads got more expensive—only use them if your CPL is under $150 or you're building long-term brand awareness.
How many LinkedIn messages should an SDR send per day?
Wrong question. Don't optimize for volume. With signal-based targeting, 15-25 highly personalized messages per day outperforms 100 template messages. Focus on reply rate (target 25%+) and meeting rate (target 10%+), not message volume.
What tools do I need to track LinkedIn lead generation metrics?
At minimum: Sales Navigator for targeting, a LinkedIn automation tool (Expandi, LaGrowthMachine, or similar) for outreach tracking, and custom CRM fields for source attribution. Add a BI tool like Looker or Tableau if you want to track velocity and close rates by source automatically.
How long does it take to see results from LinkedIn lead generation?
You'll see early indicators (acceptance rate, reply rate) within 2-3 weeks. Meetings typically start flowing in week 3-4. But real validation—close rate and pipeline velocity data—takes 90-120 days because that's how long your sales cycle is. Plan for a 6-month ramp to full program maturity.
Key Takeaways
- Pipeline velocity is the #1 metric because it directly impacts revenue and predicts deal quality. LinkedIn-sourced deals that close 20+ days faster mean 30-40% more revenue per rep annually.
- Track close rate religiously. LinkedIn leads closing at 14%+ proves program quality. Below 8% means your targeting or qualification is broken, no matter how good your acceptance rates look.
- Signal-based targeting isn't optional in 2026. Cold list outreach gets 10-20% acceptance and 3-8% replies. Signal-based gets 40-60% acceptance and 25-55% replies. The performance gap is 3-5x.
- Cost per qualified lead determines scalability. Know your fully-loaded CPL ($200-$400 for outbound, $45-$180 for ads, $50-$120 for content) and benchmark against your deal size and close rate.
- Stop tracking vanity metrics. Profile views, impressions, SSI scores, and connection count predict nothing about pipeline. They're dashboard decorations that waste leadership attention.
- Attribution is not optional. If you don't have custom CRM fields tracking LinkedIn as the original source, you're flying blind. Default CRM attribution will under-count LinkedIn's contribution by 40-60%.
- Content-engaged leads close at 2x the rate of cold outbound (16-24% vs 8-12%). If you're only doing outreach without content, you're leaving money on the table.
Related Reading
Ready to Build a LinkedIn Program That Actually Drives Pipeline?
Most B2B companies track LinkedIn metrics that don't matter and ignore the ones that predict revenue. At oneaway, we build LinkedIn lead generation programs focused on the metrics that matter: pipeline velocity, close rate, and cost per qualified lead. We handle everything from signal-based targeting and outreach automation to content programs and attribution tracking. If you're tired of vanity metrics and ready for a LinkedIn program that shows up in your revenue reports, let's talk.
Check if we're a fitContinue Reading
Appointment Setting Pricing for SaaS in 2026, Compared
What SaaS companies pay for appointment setting in 2026, by model: flat fee, per SDR, by appointment count and per meeting, with setup fees, terms and what a meeting really costs.
Read more [ 6 MIN READ ]Best Outbound Agencies for Early-Stage SaaS in 2026
Outbound agencies for early-stage SaaS with no outbound motion: who builds the domains, lists and copy from zero, what they cost to start, and which ones want later-stage companies.
Read more [ 7 MIN READ ]CIENCE Alternatives in 2026: 10 Compared, Plus SalesHive
What CIENCE charges per seat, bonus and setup included, and 10 alternatives with published prices and terms. Plus where to look instead of SalesHive.
Read more