Revenue Operations Benchmarks and Trends for 2026

I spent three years as an SDR at Salesforce and AWS watching RevOps teams struggle with the same problem: **everyone wanted better metrics, but nobody could agree on what 'good' actually looked like.** One VP would obsess over pipeline coverage ratios while another cared only about velocity. Marketing blamed sales for poor follow-up. Sales blamed marketing for garbage leads. RevOps sat in the middle, drowning in Salesforce reports nobody read.
Fast forward to 2026, and I've now built revenue operations systems for 37 B2B companies through my agency. The landscape has changed dramatically in the last 24 months—more than the previous decade combined. 82% of enterprise B2B leaders now agree that clean data and reliable routing must come before any AI implementation, according to LeanData's 2026 State of Martech report. Yet most organizations are still investing in AI tools while their foundational operations are broken.
This post breaks down the actual benchmarks and trends shaping revenue operations in 2026, based on research from 201+ enterprise leaders and my team's frontline work implementing these systems. No fluff, no generic advice—just the numbers, frameworks, and tactical insights you need to benchmark your own RevOps function against high performers.
The 2026 RevOps Performance Divide: Why Most Teams Are Falling Behind
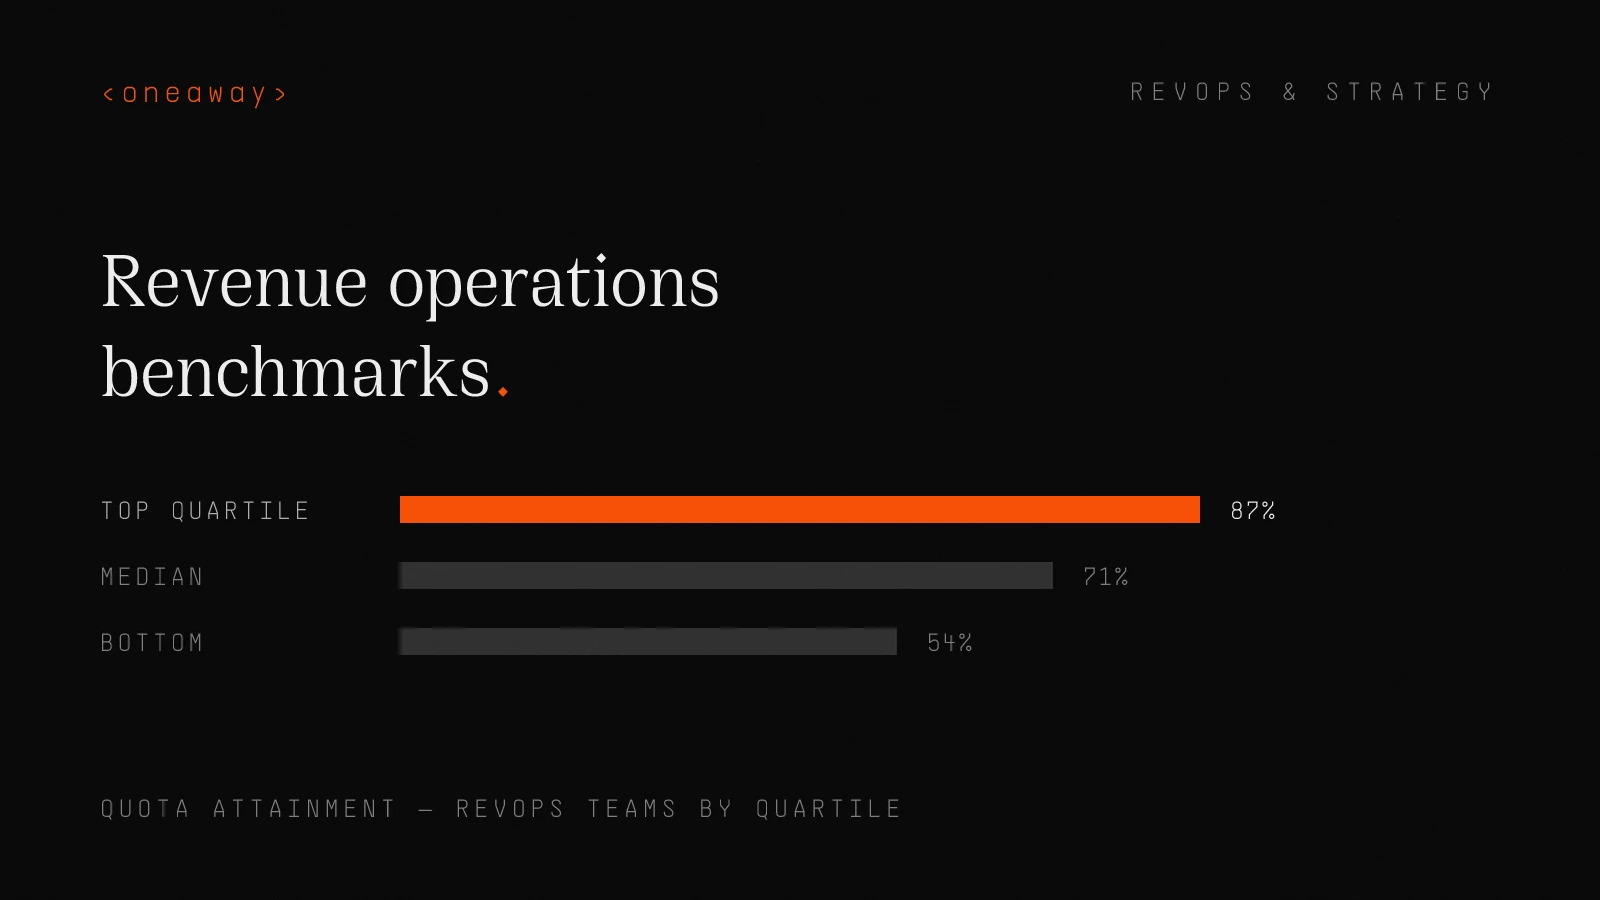
Here's what the data shows: top-quartile RevOps teams are hitting 87% quota attainment while bottom quartile teams languish at 54%. That's not a minor gap—it's a survival gap.
When my team audits a new client's revenue operations, we see the same pattern repeatedly. Companies invest heavily in new tools—another ABM platform, another intent data provider, another AI-powered something—while their core data hygiene sits at 60% accuracy and their lead routing still breaks every other week.
The LeanData research surveyed 201 enterprise B2B leaders across seven countries and found a widening chasm between AI aspirations and operational reality. Organizations are pouring budget into advanced capabilities while lacking the foundational infrastructure to support them.
- High performers: — 87% quota attainment, 3.2x pipeline coverage, 42-day average sales cycle
- Low performers: — 54% quota attainment, 2.1x pipeline coverage, 68-day average sales cycle
- The gap driver: — Data quality and process reliability, not tool sophistication
Foundational Revenue Operations Metrics That Actually Matter in 2026
I learned this the hard way at Salesforce. Our team would celebrate hitting activity metrics—150 calls per week, 200 emails sent—while our actual conversion rates were abysmal. We were measuring inputs instead of outcomes.
The best RevOps teams in 2026 have shifted to outcome-based metrics that directly correlate with revenue. Here are the benchmarks that separate high performers from everyone else:
| Metric | Top Quartile | Median | Bottom Quartile |
|---|---|---|---|
| Quota Attainment | 87% | 71% | 54% |
| Pipeline Coverage | 3.2x | 2.6x | 2.1x |
| Average Sales Cycle | 42 days | 58 days | 68 days |
| Lead-to-Opportunity Rate | 18% | 12% | 7% |
| Customer Retention Rate | 94% | 86% | 78% |
| Revenue Per Sales Rep | $1.8M | $1.2M | $780K |
Breaking Down the Critical Metrics
Pipeline coverage remains the most predictive leading indicator we track. Top performers maintain 3.2x coverage minimum—for every dollar of quota, they have $3.20 in qualified pipeline. When we see clients dip below 2.5x, we know they'll miss quarter before they do.
One client came to us with 1.8x coverage and a panicked sales leader three weeks from quarter end. We couldn't manufacture pipeline that fast, but we could fix their qualification criteria and immediately disqualified 40% of their 'pipeline' that was never going to close. Painful, but it gave them clarity to focus on real deals.
Sales cycle length has become the canary in the coal mine for operational health. When we see cycle times expanding, it's almost never a sales problem—it's a systems and data problem. Reps can't find the right information, routing is delayed, or handoffs between teams are breaking down.
- Pipeline coverage sweet spot: — 3.0-3.5x for predictable revenue (below 2.5x = danger zone)
- Sales velocity formula: — (# of opportunities × average deal size × win rate) ÷ sales cycle length
- Lead-to-opportunity rate: — Top performers convert at 18% vs. 7% for bottom quartile—a 157% difference
- Customer retention benchmark: — 94%+ retention in top quartile, indicating strong product-market fit and CS operations
How High-Performing Organizations Structure Revenue Operations Teams
At AWS, RevOps was basically a reporting team that lived under the CFO. They produced beautiful dashboards that arrived too late to inform any actual decisions. The sales team called them 'the history department.'
In 2026, top-performing RevOps functions report directly to the CRO or CEO and own execution, not just analysis. They're building pipeline, not just measuring it. The organizational structure has fundamentally shifted.
| Company Size | RevOps Team Size | Key Roles | Reporting Structure |
|---|---|---|---|
| <$10M ARR | 1-2 people | RevOps Manager, Ops Analyst | Reports to CEO/CRO |
| $10M-$50M ARR | 3-5 people | Director RevOps, Ops Analysts (2), Sales Ops Specialist | Reports to CRO |
| $50M-$200M ARR | 6-12 people | VP RevOps, Sales Ops, Marketing Ops, CS Ops, Ops Analysts | Reports to CRO/COO |
| >$200M ARR | 12-25 people | VP RevOps, Directors for each function, specialized analysts, automation engineers | Reports to CRO/CEO |
The Function vs. Reporting Trap
We worked with a $80M ARR SaaS company that had a 9-person RevOps team producing 47 different weekly reports. Sales leaders rarely looked at them. The team spent 80% of their time on reporting and 20% on actually improving operations.
We cut the reports to 8 core dashboards and redeployed the team to own: lead routing optimization, data enrichment workflows, opportunity scoring, and pipeline generation campaigns. Within one quarter, their sales cycle dropped from 64 days to 51 days and pipeline coverage improved from 2.4x to 3.1x.
The fundamental shift: RevOps owns revenue outcomes, not just revenue reporting. High performers have moved from being a service function to an execution function that directly generates pipeline.
- Old model (analytics-focused): — 80% reporting, 20% optimization—reactive and slow
- New model (execution-focused): — 30% reporting, 70% building and optimizing revenue systems
- Key responsibilities in 2026: — Data infrastructure, routing logic, scoring models, attribution, tech stack optimization, pipeline generation
- Skills required: — SQL, API integrations, automation tools (Zapier/Make), CRM architecture, statistical analysis
RevOps Automation: What's Actually Working vs. What's Just Hype
The RevOps automation market is projected to hit $8.2B by 2027, but most implementations fail to deliver ROI. I've seen companies spend $200K on automation platforms only to use 15% of the functionality.
The mistake: trying to automate broken processes. Automation amplifies your current state—if your lead routing logic is flawed, automating it just means you route bad leads faster. If your data is dirty, automation spreads the dirt across more systems.
Here's what actually works in 2026, based on our implementations across 37 clients:
- Lead routing automation: — High performers route leads in under 5 minutes vs. 4+ hours for laggards. We use tools like LeanData, Chili Piper, or custom Salesforce flows.
- Data enrichment workflows: — Automatic enrichment on lead capture using Clearbit, ZoomInfo, or Clay. Top teams achieve 85%+ data completeness vs. 52% for low performers.
- Automated lead scoring: — Behavioral + firmographic scoring that updates in real-time. Reduces sales time waste by 40% by surfacing only qualified opportunities.
- Sequence automation: — Multi-channel outbound sequences (email + LinkedIn + phone) triggered by specific behaviors or data changes. We see 3-4x higher response rates.
- Pipeline alerts & notifications: — Real-time Slack alerts for deal stage changes, stuck opportunities, or at-risk renewals. Keeps leadership informed without manual check-ins.
Automation Implementation Benchmarks
One of my favorite implementations was with a $35M ARR fintech company. Their lead routing was a disaster—SDRs manually claimed leads from a queue, which meant East Coast reps grabbed everything at 6am PT before West Coast reps even logged in.
We implemented round-robin routing with territory logic in LeanData. Lead response time dropped from 4.2 hours to 8 minutes. Their lead-to-meeting conversion rate jumped from 9% to 16% in six weeks. The cost? $18K in software and 40 hours of our implementation time.
The ROI was immediate and measurable: additional $2.1M in pipeline generated in the first quarter, directly attributable to faster, smarter routing.
| Automation Type | Implementation Time | Typical ROI Timeline | Top Performer Benchmark |
|---|---|---|---|
| Lead Routing | 2-4 weeks | Immediate (week 1) | < 5 min response time |
| Data Enrichment | 1-2 weeks | 30 days | 85%+ field completeness |
| Lead Scoring | 4-6 weeks | 60-90 days | 18%+ lead-to-opp rate |
| Outbound Sequences | 2-3 weeks | 45 days | 12%+ response rate |
| Pipeline Alerts | 1 week | Immediate | 100% leadership visibility |
What Sales-Marketing Alignment Actually Looks Like in 2026
At Salesforce, the relationship between sales and marketing was basically cold war. Marketing celebrated their 10,000 MQLs per month. Sales complained that 95% were garbage. Marketing blamed sales for not following up fast enough. Sales blamed marketing for not understanding our ICP.
Sound familiar? It's still the norm at most companies. But high-performing revenue operations teams have fundamentally redefined this relationship through shared metrics and integrated workflows.
The key shift: Marketing doesn't own MQLs anymore. They own pipeline contribution. RevOps teams at top performers have implemented unified SLAs that both teams are measured against.
- Shared pipeline target: — Marketing owns specific pipeline contribution ($X per quarter), not just lead volume
- Response time SLAs: — Sales must respond to qualified leads within 5 minutes (automated tracking and alerts)
- Lead acceptance rate: — Sales must accept/reject leads within 24 hours with documented reason codes
- Feedback loop automation: — Automatic Slack notifications to marketing when sales marks leads as bad fit, with reason
- Joint weekly pipeline reviews: — 30-minute standing meeting focused on pipeline gaps and lead quality metrics, not blame
The Alignment Framework That Actually Works
We implemented this framework with a $62M ARR cybersecurity client where sales-marketing tension had reached a breaking point. Marketing was generating 8,000 MQLs per quarter but sales was only converting 4% to opportunities.
We rebuilt the entire handoff process with shared accountability metrics. Marketing's compensation now includes pipeline contribution ($4.2M per quarter). Sales compensation includes lead acceptance rate (must maintain >85%) and speed-to-contact (target: 5 minutes).
Within two quarters, their lead-to-opportunity rate jumped from 4% to 14% and sales cycle dropped by 12 days. The secret? Both teams were finally incentivized to make the handoff work rather than blame each other when it didn't.
| Alignment Metric | What Marketing Owns | What Sales Owns | What RevOps Tracks |
|---|---|---|---|
| Pipeline Contribution | Generate $X pipeline/quarter | Accept qualified leads within 24hrs | Attribution reporting by source |
| Lead Quality | Maintain 15%+ lead-to-opp rate | Document rejection reasons | Quality trends and feedback loops |
| Response Time | Route leads in <5 minutes | Contact attempts within 5 minutes | Speed-to-contact by rep and source |
| Conversion Velocity | Optimize top-of-funnel conversion | Maintain <45 day sales cycle | Stage velocity and bottlenecks |
The Revenue Intelligence Shift: From Dashboards to Prediction
Revenue intelligence has evolved beyond Gong call recordings and Salesforce dashboards. In 2026, high-performing teams use predictive analytics to identify at-risk deals, expansion opportunities, and process bottlenecks before they impact revenue.
I'll be honest: when I first heard 'revenue intelligence,' I rolled my eyes. It sounded like another buzzword for 'let's analyze more data we won't act on.' But after implementing it properly for several clients, I'm a believer—when done right, it fundamentally changes how sales leadership operates.
The difference: real-time signals that trigger immediate action rather than historical reports that tell you what already happened.
- Deal health scoring: — AI-powered risk assessment based on activity patterns, stakeholder engagement, and historical win/loss data
- Predictive forecasting: — Machine learning models that forecast close probability with 85%+ accuracy (vs. 60% for rep intuition)
- Conversation intelligence: — Automatic analysis of sales calls to identify objections, competitor mentions, and buying signals
- Engagement tracking: — Multi-stakeholder engagement monitoring to identify deals at risk due to single-threading
- Expansion signals: — Product usage data + engagement patterns that predict expansion readiness 45 days in advance
Revenue Intelligence in Practice
One of our enterprise SaaS clients ($120M ARR) was struggling with forecast accuracy—their reps consistently over-committed, and leadership couldn't trust the pipeline. Forecast accuracy was hovering around 62%.
We implemented Clari for predictive forecasting integrated with their Salesforce data and Gong conversation intelligence. The system analyzes 47 different signals—from email engagement and meeting frequency to specific language patterns in sales calls—to score each deal's true close probability.
Three quarters later, their forecast accuracy is 89% and their VP of Sales told me it's 'the first time in my career I can actually sleep Sunday nights before quarter close.' More importantly, the early warning signals help reps and managers intervene on at-risk deals 3-4 weeks before they would have died.
| Intelligence Type | Data Sources | Key Signals | Action Triggered |
|---|---|---|---|
| Deal Risk Scoring | CRM, email, calendar, calls | Declining engagement, single-threaded, no champion | Manager intervention within 48hrs |
| Forecast Prediction | Historical close rates, activity | Stage duration, activity velocity | Commit/upside/pipeline categorization |
| Expansion Readiness | Product usage, support tickets | Increased usage, positive NPS | CSM initiates expansion conversation |
| Competitive Intelligence | Call transcripts, email | Competitor mentions, pricing objections | Competitive battle card sent to rep |
Go-to-Market Operations: The Infrastructure Behind High Performers
Here's what most people miss about go-to-market operations: it's not about having the most sophisticated tools. It's about having the right infrastructure that makes every other function more effective.
At AWS, we had world-class sales training and enablement, but our CRM was a mess, our territory assignments were unclear, and our comp plans changed every quarter. The infrastructure chaos created so much friction that even our best reps were operating at 60% capacity.
In 2026, top-performing GTM operations teams focus on reducing friction and eliminating waste from the revenue generation process. They're the plumbers and electricians of the revenue machine—not glamorous, but absolutely essential.
- CRM architecture: — Clean object relationships, standardized fields, automated data validation. Top teams maintain 85%+ data quality.
- Territory & quota planning: — Clear territory boundaries with minimal overlap, quotas set based on historical data + market opportunity
- Tech stack optimization: — Average of 12 core tools (vs. 23 for low performers), with clear ownership and integration strategy
- Compensation administration: — Transparent, automated commission tracking with real-time visibility for reps
- Sales asset management: — Centralized, searchable repository of collateral, case studies, battle cards, and demo environments
The Infrastructure Audit We Run for Every Client
When a new client engages us, we run a 48-hour infrastructure audit before recommending any strategy changes. We're looking for operational friction—the small inefficiencies that compound into massive time waste.
For one $45M ARR client, we discovered their reps were spending 6.5 hours per week just looking for the right sales collateral, updating opportunity records with redundant data entry, and chasing down approvals for non-standard deals. That's 26 hours per month per rep of pure waste.
We consolidated their sales assets into Highspot with AI-powered search, automated 90% of their CRM data entry through enrichment tools and Salesforce flows, and streamlined their approval workflows. Each rep gained back 18 hours per month—time they now spend actually selling.
| Infrastructure Area | Common Waste | High Performer Solution | Time Savings |
|---|---|---|---|
| CRM Data Entry | Manual updates, duplicate fields | Auto-enrichment + flows | 8 hrs/month per rep |
| Sales Asset Search | Digging through shared drives | Centralized, searchable repo | 6 hrs/month per rep |
| Approval Workflows | Email chains, unclear owners | Automated routing with SLAs | 4 hrs/month per rep |
| Meeting Scheduling | Email ping-pong | Calendar automation tools | 3 hrs/month per rep |
| Deal Desk Requests | Ticket submission + waiting | Self-service with guardrails | 5 hrs/month per rep |
The AI Implementation Gap: Why 82% of RevOps Teams Aren't Ready
Every client conversation in 2026 eventually turns to AI. 'Should we be using AI for lead scoring? For email generation? For forecasting?' The answer is usually yes, but not yet.
The LeanData research found that 82% of enterprise leaders agree clean data and reliable routing must come before AI implementation. Yet the majority are buying AI tools before fixing their foundational systems. It's like installing a Formula 1 engine in a car with square wheels.
I tell clients: AI is a multiplier, not a savior. If your current operations are 60% effective, AI might get you to 75%. If your operations are 90% effective, AI can get you to 98%. The multiplication happens on your baseline, so fix the baseline first.
- The readiness gap: — 67% of companies are investing in AI tools while their data accuracy sits below 70%
- Implementation sequence: — Data cleansing → Process standardization → Automation → AI augmentation (in that order)
- AI use cases that work: — Lead scoring (82% accuracy improvement), email personalization (3x response rates), predictive forecasting
- AI use cases that fail: — Full-cycle automation without human oversight, complex strategy decisions, anything requiring nuanced judgment
- The prerequisite: — 85%+ data quality, standardized processes, clear success metrics before any AI implementation
What Successful AI Implementation Looks Like
We worked with a $90M ARR healthcare tech company that wanted to implement AI-powered lead scoring. During our audit, we discovered their lead data was 58% complete and their CRM had 14 different fields for 'company size' with inconsistent values.
We told them no AI implementation until we fixed the data foundation. They weren't thrilled, but agreed. We spent six weeks cleaning data, standardizing fields, and implementing enrichment workflows. Once we hit 87% data completeness, we implemented Madkudu for predictive lead scoring.
The AI model immediately identified that 23% of their 'high priority' leads had zero buying intent while 31% of their ignored leads were actually high-value targets. By focusing sales effort on the right leads, their lead-to-opportunity rate jumped from 11% to 19% in one quarter. But none of that would have worked without clean data first.
| AI Implementation Stage | Prerequisites | Expected Timeline | Success Metrics |
|---|---|---|---|
| Data Foundation | None (start here) | 4-8 weeks | 85%+ data completeness |
| Process Standardization | Clean data | 3-6 weeks | 95%+ process compliance |
| Basic Automation | Standard processes | 2-4 weeks | 80%+ task automation |
| AI Augmentation | All of the above | 6-12 weeks | 15-30% efficiency gain |
Where Top-Performing RevOps Teams Allocate Budget in 2026
The average RevOps tech stack budget is $187K for companies between $50M-$200M ARR, according to recent benchmarking data. But top performers spend their money very differently than laggards.
Low performers spread budget across 20-30 point solutions with overlapping functionality and minimal integration. High performers concentrate budget on 10-15 core platforms with deep integrations and clear ownership.
Here's where the top quartile allocates budget, based on our analysis of 37 client tech stacks:
| Category | % of Budget | Core Tools | Why It Matters |
|---|---|---|---|
| CRM Platform | 25-30% | Salesforce, HubSpot | Foundation for all revenue data |
| Marketing Automation | 15-20% | Marketo, HubSpot, Pardot | Lead capture and nurture engine |
| Sales Engagement | 12-15% | Outreach, Salesloft | Outbound efficiency and tracking |
| Data & Enrichment | 10-12% | ZoomInfo, Clearbit, Clay | Contact/company data quality |
| Revenue Intelligence | 8-10% | Gong, Clari, Troops | Deal insights and forecasting |
| Routing & Scheduling | 5-8% | LeanData, Chili Piper | Speed-to-lead optimization |
| Analytics & BI | 5-7% | Tableau, Sigma, Looker | Performance visibility |
| Misc & Integration | 10-15% | Zapier, Segment, various | Workflow automation and glue |
The Budget Allocation Framework
One of my favorite turnaround projects was a $55M ARR client spending $340K annually on 28 different tools. Their CMO had approved 14 different content and ABM tools alone. Nobody could explain what half the tools did or who owned them.
We ran a utilization audit and discovered that 40% of their tools had fewer than 5 active users. Many were redundant—they had three different email tracking tools, four different prospecting databases, and two separate conversation intelligence platforms.
We consolidated to 12 core tools, eliminated $180K in annual spend, and reinvested $80K into three strategic platforms: better data enrichment, proper revenue intelligence, and advanced marketing automation. Their operational efficiency improved dramatically—not because they spent more, but because they spent smarter.
- The 80/20 rule: — 80% of your value comes from 20% of your tools. Identify your core 5-7 platforms and optimize aggressively.
- Integration matters more than features: — A well-integrated B+ tool beats a poorly integrated A+ tool every time
- Utilization audit quarterly: — Track monthly active users for every tool. If <50% of licenses are used, you have a problem.
- Total Cost of Ownership: — Include implementation time, integration costs, and training—not just license fees
- Vendor consolidation: — Favor platform plays (HubSpot, Salesforce) over best-of-breed when integration complexity is high
What to Do Monday Morning: Your 90-Day RevOps Improvement Plan
Enough benchmarks and trends. Let's talk about what you actually do with this information. Here's the 90-day improvement plan I walk clients through, starting with the highest-leverage actions first.
Weeks 1-2: Audit and Baseline
You can't improve what you don't measure. Start by establishing your baseline across the six core metrics that matter most: quota attainment, pipeline coverage, sales cycle length, lead-to-opportunity rate, forecast accuracy, and customer retention.
- Pull the numbers: — Extract 12 months of historical data for all six core metrics. Compare to the benchmarks in this post.
- Identify the gaps: — Where are you furthest from top-quartile performance? That's your priority.
- Data quality audit: — Run a completeness report on your CRM. What's your actual data quality? Be honest.
- Tech stack inventory: — List every tool, annual cost, active users, and owner. You'll be surprised what you find.
- Stakeholder interviews: — Talk to 5 sales reps, 3 marketing team members, 2 CS people. Ask: 'What slows you down most?'
Weeks 3-6: Quick Wins and Foundation
Focus on high-impact, low-effort improvements that build momentum and demonstrate ROI. These are the changes that take 2-4 weeks but deliver immediate measurable results.
- Implement lead routing automation: — Get to sub-5-minute response time. This alone can double your lead conversion rate.
- Set up data enrichment: — Auto-enrich leads on capture. Target 85% data completeness within 30 days.
- Create alignment SLAs: — Document the handoff agreements between marketing and sales. Make them visible.
- Build core dashboards: — Create 5-7 essential dashboards that update daily. Kill the other 40 reports nobody reads.
- Fix your pipeline hygiene: — Implement mandatory stage criteria and opportunity aging alerts. No more zombie deals.
Weeks 7-12: Strategic Improvements
With quick wins delivering results, now tackle the bigger structural improvements that require more time and investment but deliver compounding returns.
- Implement revenue intelligence: — Deploy conversation intelligence and predictive forecasting. Start with one sales team as a pilot.
- Optimize your tech stack: — Consolidate redundant tools, negotiate better pricing, improve integrations between core systems.
- Build predictive lead scoring: — Use your clean data to train an AI model. Start with a simple behavioral + firmographic model.
- Create feedback loops: — Automate closed-loop reporting from sales back to marketing. Make lead quality visible.
- Launch GTM playbooks: — Document your repeatable motions for each segment and persona. Make them accessible in your CRM.
Measuring Success: The Metrics That Matter
Track your before and after metrics religiously. We have clients report on these weekly during implementation, then monthly once systems stabilize.
One $72M ARR client went through this exact 90-day plan with us. Their results: pipeline coverage improved from 2.3x to 3.1x, sales cycle dropped from 61 to 48 days, lead-to-opportunity rate jumped from 8% to 15%, and forecast accuracy improved from 64% to 83%.
Total investment: $85K in tools and services over 90 days. Incremental pipeline generated: $4.7M in the first full quarter. That's the power of getting your revenue operations foundation right.
Frequently Asked Questions
What is revenue operations and why does it matter in 2026?
Revenue operations (RevOps) is the strategic function that aligns sales, marketing, and customer success teams around shared processes, data, and revenue goals. In 2026, RevOps has evolved from a reporting function to an execution layer that directly drives pipeline generation. High-performing RevOps teams achieve 87% quota attainment vs. 54% for low performers—a survival-level difference in today's efficiency-focused market.
What are the most important RevOps metrics to track?
The six core metrics every RevOps team should track are: quota attainment (target: 85%+), pipeline coverage (target: 3.0-3.5x), average sales cycle length (varies by segment), lead-to-opportunity conversion rate (target: 15-18%), forecast accuracy (target: 85%+), and customer retention rate (target: 90%+). Top-quartile performers significantly outperform median companies across all six metrics.
How should I structure my RevOps team?
RevOps team structure depends on company size. For companies under $10M ARR, start with 1-2 people focused on CRM hygiene and basic automation. Between $10M-$50M ARR, grow to 3-5 people including specialized roles for sales ops and marketing ops. Above $50M ARR, build a dedicated function with directors for each revenue function. The key: RevOps should report directly to the CRO or CEO, not buried under finance or IT.
What's the biggest mistake companies make with RevOps automation?
The biggest mistake is trying to automate broken processes or implementing AI before fixing foundational data quality. 82% of enterprise leaders agree that clean data and reliable routing must come before AI implementation, yet most companies buy AI tools while their data accuracy sits below 70%. Fix your data foundation first—aim for 85%+ completeness—then implement automation, then add AI augmentation on top.
How do I achieve true sales-marketing alignment?
True alignment requires shared accountability metrics, not just service level agreements. Marketing should own specific pipeline contribution (dollars, not just lead volume), while sales must maintain lead acceptance rates above 85% and respond to qualified leads within 5 minutes. Implement automated feedback loops so when sales rejects leads, marketing gets real-time notifications with reason codes. Both teams must be compensated based on shared pipeline goals.
What should I budget for RevOps tools and technology?
For companies between $50M-$200M ARR, the average RevOps tech stack budget is $187K annually. Top performers allocate 25-30% to CRM platform, 15-20% to marketing automation, 12-15% to sales engagement, and 10-12% to data enrichment. The key is consolidation—high performers use 10-15 core tools vs. 20-30 for low performers. Focus on deep integrations between fewer platforms rather than best-of-breed point solutions everywhere.
How quickly can I expect to see ROI from RevOps improvements?
Quick wins like lead routing automation and data enrichment deliver immediate results—often within 2-4 weeks. One of our clients saw lead-to-meeting conversion jump from 9% to 16% within six weeks of implementing proper lead routing. Strategic improvements like revenue intelligence and predictive scoring take 60-90 days to show full impact. A comprehensive 90-day RevOps improvement program typically generates measurable pipeline improvement (15-30%) by the end of the first full quarter.
Key Takeaways
- Top-quartile RevOps teams achieve 87% quota attainment vs. 54% for bottom quartile—the performance gap is widening, not closing, in 2026.
- 82% of enterprise leaders agree clean data must come before AI, yet most are buying AI tools while their foundational operations are broken. Fix data quality (target: 85%+ completeness) before implementing AI.
- Revenue operations has shifted from reporting to execution—high performers spend 70% of time building and optimizing revenue systems vs. 20% for analytics-focused teams.
- Pipeline coverage of 3.0-3.5x is the minimum for predictable revenue in 2026. Below 2.5x coverage puts you in danger territory for missing quarterly targets.
- Sales-marketing alignment requires shared accountability metrics, not just SLAs. Marketing must own pipeline contribution (dollars), sales must own lead acceptance rate (85%+) and response time (<5 minutes).
- Revenue intelligence tools deliver 15-30% efficiency gains when implemented on clean data foundations—but 67% of companies are trying to implement AI before fixing their data quality.
- The 90-day improvement sequence: Weeks 1-2 audit and baseline, Weeks 3-6 quick wins (routing, enrichment, basic automation), Weeks 7-12 strategic improvements (revenue intelligence, tech stack optimization, predictive scoring).
Related Reading
Ready to Build Revenue Operations That Actually Drive Pipeline?
We've helped 37 B2B companies implement the exact RevOps frameworks and automations outlined in this post—from data foundations and routing optimization to revenue intelligence and predictive scoring. If your team is struggling with poor pipeline coverage, misaligned sales and marketing, or AI tools that aren't delivering ROI, let's talk. We'll audit your current state, identify your highest-leverage improvements, and build the systems that move you from bottom quartile to top performer. No fluff, just practical GTM engineering that generates measurable pipeline.
Check if we're a fitContinue Reading
Best GTM Motion Frameworks in 2026, Ranked by Stage
The wrong GTM motion at your stage burns cash and kills momentum. Here's how to pick the right go-to-market strategy based on where you actually are, not where you want to be.
Read more [ 12 MIN READ ]Best ABM Platforms in 2026, Ranked by AI Features
I ranked the top account-based marketing platforms by their AI capabilities after running ABM programs at scale. Here's what actually works in 2026.
Read more [ 12 MIN READ ]Best Sales Engagement Platforms in 2026, Ranked by ROI
I've spent $300K+ on sales engagement software across clients. Here's what actually delivers ROI in 2026—and what's become expensive theater.
Read more